Agentic AI - Observability
Intro
When you’re building modern software systems—especially anything powered by generative or agentic AI—observability quickly becomes one of the most important non-functional areas to get right (along with security). Once your system hits production, you lose the safety net of local logs and controlled environments, and without proper observability you’re effectively operating blind. While “observability” is a broad landscape with entire companies built around it, there are a few fundamentals that matter for every team: stick to structured logging, lean into OpenTelemetry standards, and make sure you can trace and visualize how your system behaves end-to-end. This is even more critical for AI systems where behavior is non-deterministic and multiple tools interact behind the scenes—if you can’t see your spans, your traces, and how each component performs, you can’t understand (let alone improve) what’s actually happening.
In traditional software observability—regardless of which vendor or tool you choose—you’ll typically have metrics dashboards that track resource usage, request rates, and system health (something like the example below). These foundational dashboards remain essential even when building MCP servers or AI-powered web clients, because at the end of the day, these components still need infrastructure to run on, and you need visibility into how that infrastructure is performing. Here’s a typical infrastructure-level dashboard—still essential even in LLM-heavy systems
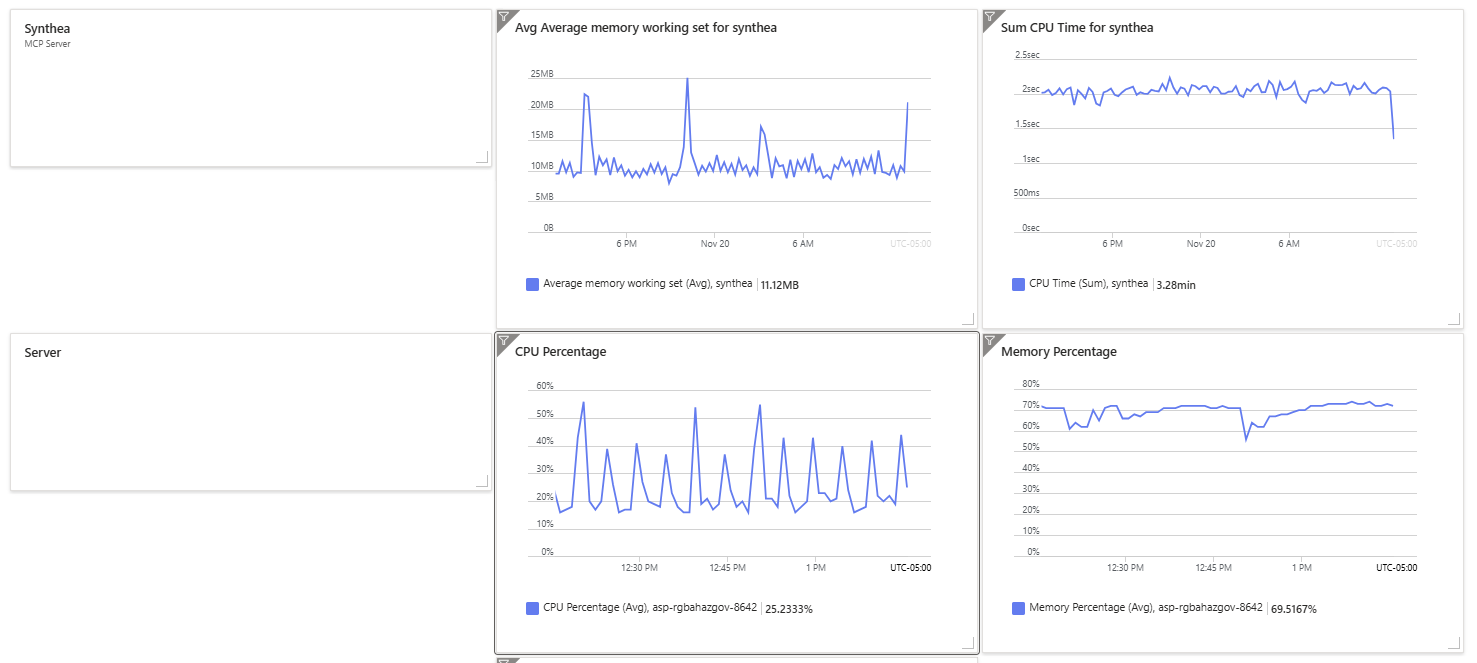
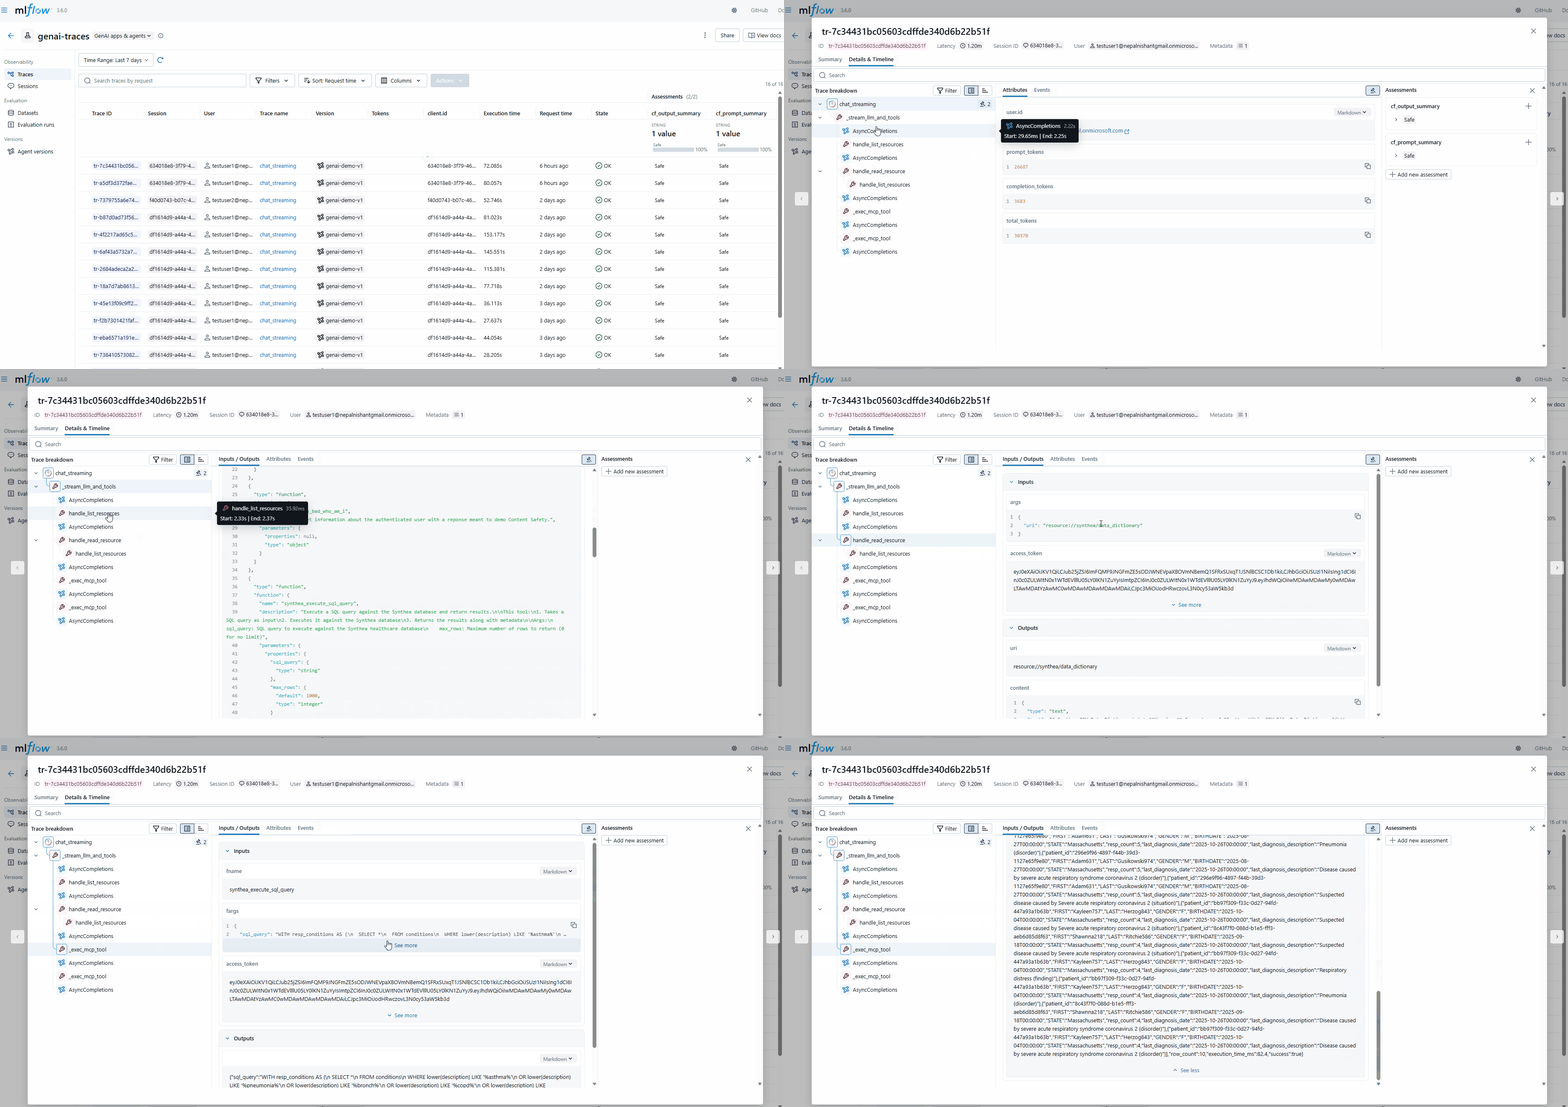
It’s the other pillar of observability—traces, inputs, and outputs—where your tooling choices really matter. You want a solution that does as much autowiring as possible out of the box, regardless of which LLMs you use, but also lets you extend and tag components as needed. The best tools here are purpose-built for AI workflows. I use MLflow, but there are other options; with MLflow, you can autolog all LLM calls automatically:
1
mlflow.openai.autolog()
but you can also extend your tool calls (or wrappers)
1
2
3
4
5
6
7
8
9
10
11
12
13
14
15
16
17
18
19
20
21
22
23
24
25
@mlflow.trace(span_type=SpanType.TOOL)
async def handle_list_resources(args: dict) -> dict:
    # ....logic below

# From MLFlow Code
class SpanType:
    """
    Predefined set of span types.
    """

    LLM = "LLM"
    CHAIN = "CHAIN"
    AGENT = "AGENT"
    TOOL = "TOOL"
    CHAT_MODEL = "CHAT_MODEL"
    RETRIEVER = "RETRIEVER"
    PARSER = "PARSER"
    EMBEDDING = "EMBEDDING"
    RERANKER = "RERANKER"
    MEMORY = "MEMORY"
    UNKNOWN = "UNKNOWN"
    WORKFLOW = "WORKFLOW"
    TASK = "TASK"
    GUARDRAIL = "GUARDRAIL"
    EVALUATOR = "EVALUATOR"
Session Grouping for Chat Applications
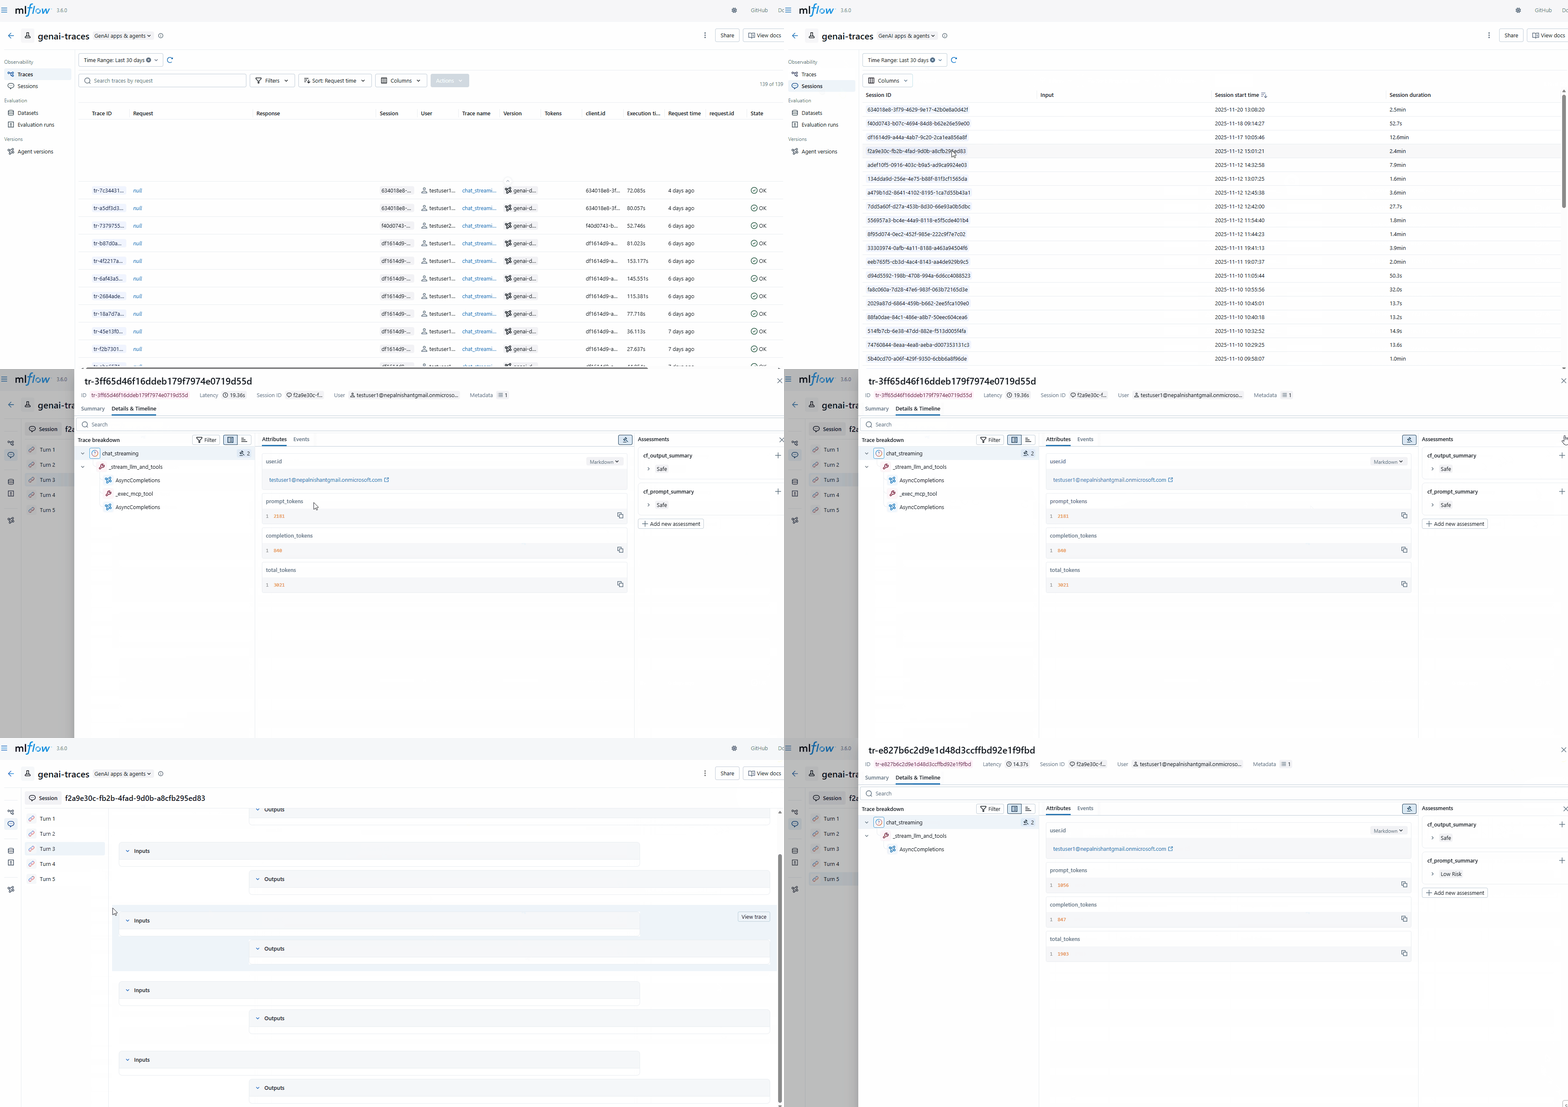
One thing that I really like about MLFlow is the session tab - this is very handy when dealing with chat applications where every call to the LLM is a separate trace. By passing in a grouping identified (the threadid, a session id or any unique grouping identifier), MLFlow can automatically group that so that you can get an end to end view which is invaluable.
LLM as a judge for SRE functions
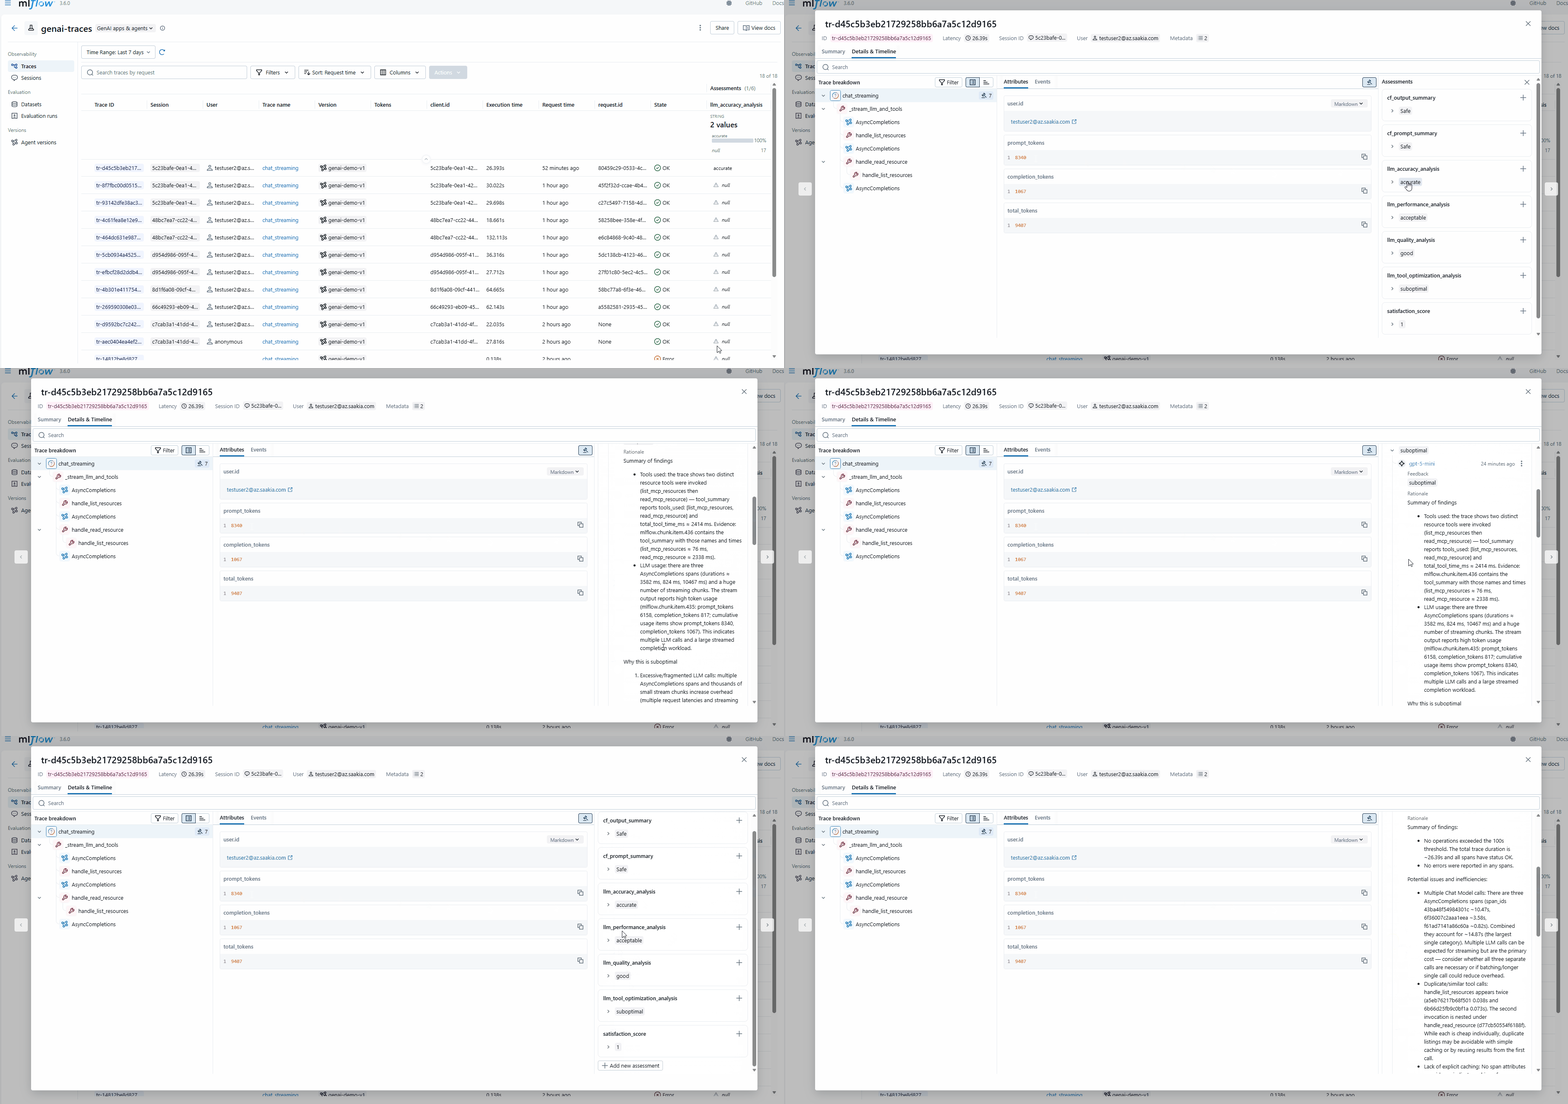
Beyond basic trace visualization, observability tools can also help you automatically identify issues. Using the LLM as a judge pattern, we can scale catching issues with our application to a really high level. By defining performance target scorers in this format
1
2
3
4
5
6
7
8
9
10
11
12
13
14
15
16
17
18
19
20
21
22
23
24
25
26
27
28
29
30
performance_judge = make_judge(
    name="performance_analyzer",
    instructions=(
        "Analyze the  for performance issues.\n\n"
        "Check for:\n"
        "- Operations taking longer than 100 seconds\n"
        "- Redundant API calls or database queries\n"
        "- Inefficient data processing patterns\n"
        "- Proper use of caching mechanisms\n\n"
        "- Any errors in responses from tool calling\n\n"
        "Rate as: 'optimal', 'acceptable', or 'needs_improvement'"
    ),
    model=f"azure:/{AZURE_OPENAI_DEPLOYMENT_NAME}",
)

tool_optimization_judge = make_judge(
    name="tool_optimizer",
    instructions=(
        "Analyze tool usage patterns in .\n\n"
        "Check for:\n"
        "1. Unnecessary tool calls (could be answered without tools)\n"
        "2. Wrong tool selection (better tool available)\n"
        "3. Inefficient sequencing (could parallelize or reorder)\n"
        "4. Missing tool usage (should have used a tool)\n\n"
        "Provide specific optimization suggestions.\n"
        "Rate efficiency as: 'optimal', 'good', 'suboptimal', or 'poor'"
    ),
    feedback_value_type=Literal["optimal", "good", "suboptimal", "poor"],
    model=f"azure:/{AZURE_OPENAI_DEPLOYMENT_NAME}"
)
and then running these againts the traces
1
2
3
4
5
6
7
8
9
10
11
12
13
  base = f"timestamp >= {since}"
  traces = mlflow.search_traces(experiment_ids=[experiment_id], return_type="list",filter_string=base)
  for trace in traces:
      feedback = accuracy_judge(trace=trace)
      mlflow.log_feedback(
              trace_id=trace.info.trace_id,
              name="llm_accuracy_analysis",
              value=feedback.value,
              rationale=feedback.rationale,
              source=AssessmentSource(
                  source_type=AssessmentSourceType.LLM_JUDGE, source_id=os.getenv("AZURE_OPENAI_DEPLOYMENT_NAME", "gpt-4")
              ),
      )
you can get a rich feedback on your traces. Pretty cool!
Summary
The tool is secondary—the important part is that you actually have detailed monitoring that you can query, correlate, and operate with. Beyond just logging traces, also consider how easily you can query and correlate logs using both UI and API.Most tools provide adequate UI functionality, but may be locked down for api for getting data out for non UI analysis.
I should also note that for production high volume monitoring, you may want to consider “sampling” and also ensure that logs are non-blocking. If you are using MLFlow, it has a handy reference list here
Finally, don’t forget that LLM traces may include user inputs or sensitive content—ensure your logging backend complies with your organization’s data policies.